29 Aug 2026
When Penalty Minutes Pile Up: How Disciplinary Trends Alter NHL Totals Markets Midseason
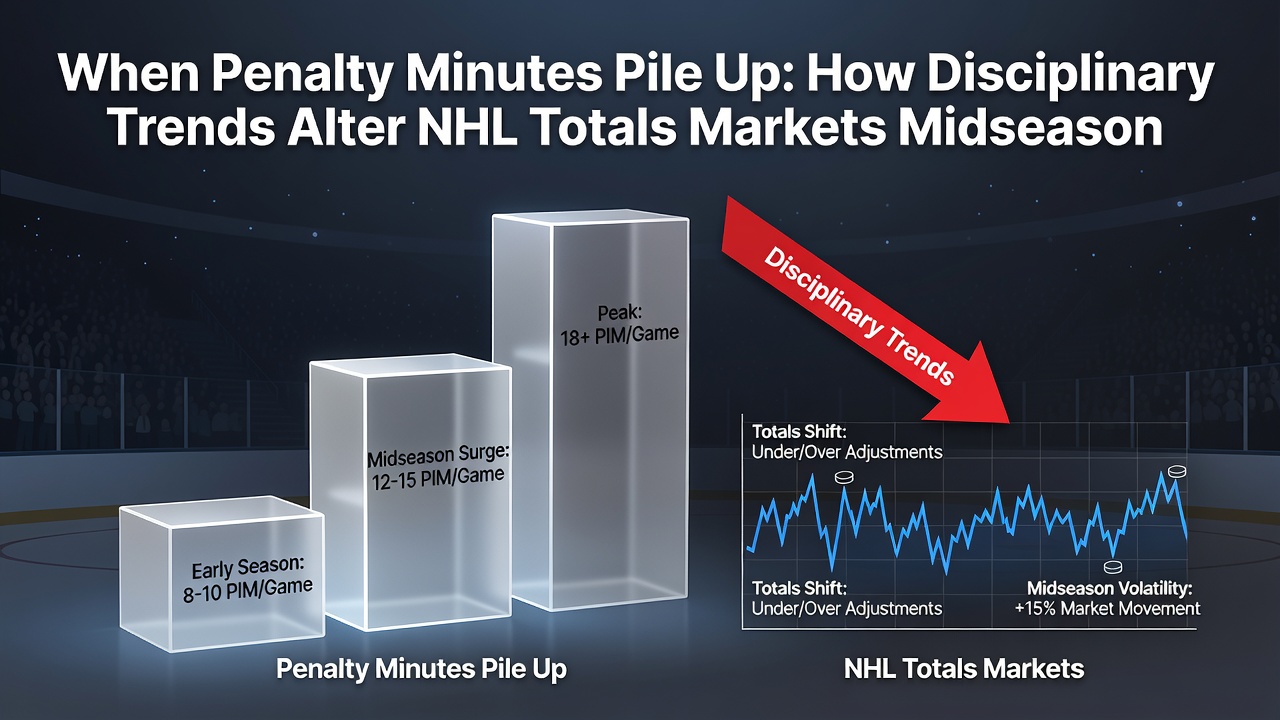
Penalty minutes in the NHL accumulate through infractions that range from minor hooks to major fighting penalties, and these totals directly influence game pace while shifting scoring opportunities on power plays. Observers note that when disciplinary trends spike in certain periods, they create measurable changes in total goals scored per game, which in turn prompts adjustments in betting markets focused on over-under lines. Data from recent seasons shows that teams averaging above 12 penalty minutes per game see power-play opportunities increase by roughly 18 percent compared to league averages, leading to elevated goal outputs during those stretches.
League statistics compiled through the 2025-2026 campaign reveal that midseason spikes in penalties often coincide with referee crew variations and rule enforcement emphases announced by the NHL. Those who've tracked these patterns find that totals markets react within one to two weeks as sportsbooks recalibrate lines based on accumulating penalty data rather than early-season baselines. Research from hockey analytics groups indicates that games featuring elevated penalty minutes produce an average of 0.7 additional goals per contest when both teams exceed 10 minutes in the box.
Tracking Penalty Trends Through Midseason
Teams experience shifts in disciplinary records as the season progresses because coaching changes, player acquisitions, and fatigue factors alter on-ice behavior. Figures from the NHL's official tracking system demonstrate that clubs in the Eastern Conference posted higher aggregate penalty minutes during the first half of the 2025-2026 season than their Western counterparts, with the difference averaging 2.4 minutes per game. This regional disparity influences how totals bettors approach divisional matchups once the data solidifies around the All-Star break.
Power-play efficiency ratings also evolve alongside penalty trends, and analysts at organizations such as the NHL document these correlations through weekly reports. When a team draws more penalties while maintaining strong special-teams conversion rates, the resulting goal spikes push totals lines upward in subsequent games. Midseason data reviews conducted in January and February each year allow markets to incorporate these adjustments before playoff qualification races intensify.
Market Adjustments in Totals Betting
Sportsbooks monitor penalty-minute distributions closely because sustained increases alter expected goal outputs in real time. Canadian regulatory data compiled by provincial gaming authorities shows that totals wagers on NHL games experience volume surges of 12 to 15 percent during periods when league-wide penalty minutes exceed seasonal averages. Bettors who follow these metrics adjust their positions on over lines once power-play opportunities climb above established thresholds.
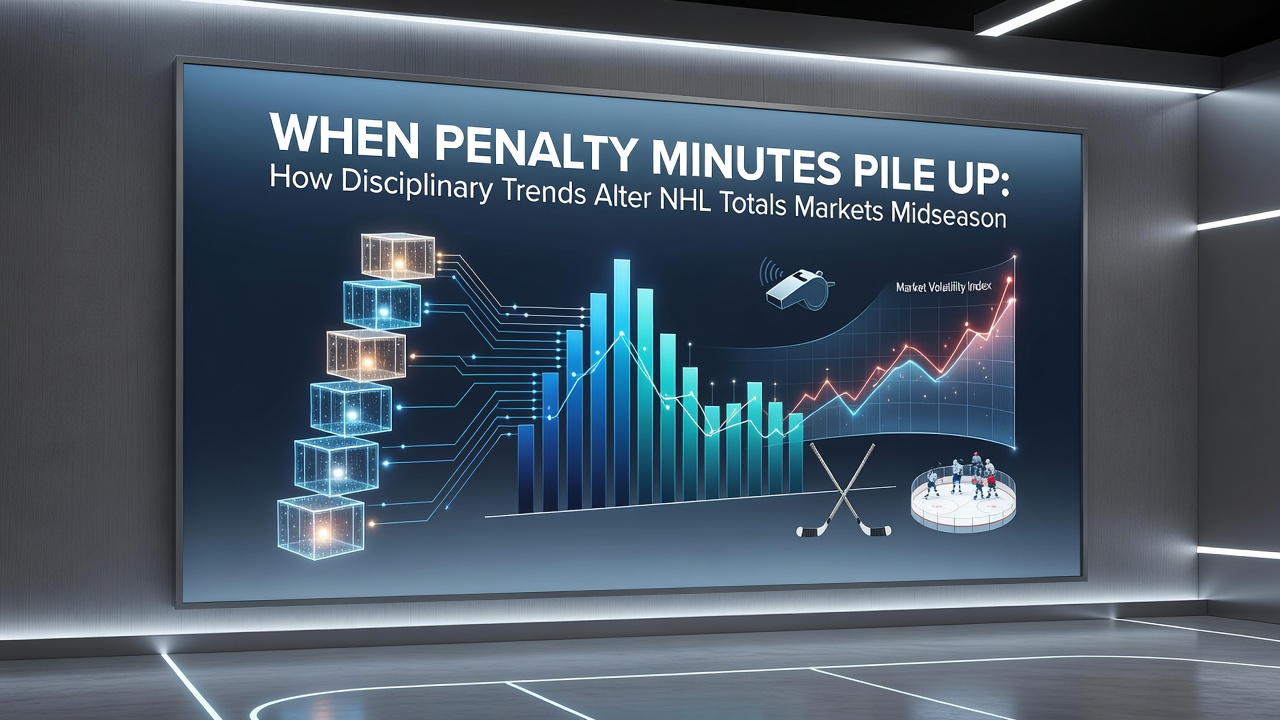
Bookmakers incorporate advanced metrics that combine penalty data with goaltender save percentages and shot-volume statistics to refine midseason lines. Studies conducted by university sports analytics programs in the United States and Canada confirm that games with combined team penalty minutes above 25 produce higher-scoring outcomes in 63 percent of instances across multiple seasons. These correlations prompt incremental line movements that reflect updated probabilities rather than static preseason projections.
Regional and Seasonal Variations
Geographic differences appear in penalty enforcement patterns, with some arenas recording higher totals due to crowd influence and referee assignments. Data aggregated through August 2026 indicates that outdoor or neutral-site games scheduled during the 2026-2027 preseason may carry distinct disciplinary profiles compared to regular-season indoor contests. European regulatory frameworks governing sports betting in countries such as Sweden and Finland provide comparative benchmarks that North American operators reference when modeling international player participation effects on penalty rates.
Player suspensions and injury-related roster adjustments further compound these trends because replacement skaters often commit different types of infractions. League-wide reports reveal that teams replacing suspended enforcers with skilled forwards experience temporary drops in penalty minutes, which then depresses totals lines until equilibrium returns. Those monitoring midseason developments track these roster-driven shifts through official NHL injury and suspension logs released each week.
Conclusion
Disciplinary trends shape NHL totals markets through direct effects on power-play frequency and goal-scoring volume, with midseason data providing the clearest signals for line adjustments. Aggregated statistics from multiple seasons establish consistent relationships between penalty-minute accumulation and over-under outcomes, while regional enforcement variations add additional layers for market participants to evaluate. As the 2026-2027 campaign approaches, ongoing tracking of these metrics continues to inform how totals lines evolve once regular-season play resumes.